The principal input function to a ggoutbreak simulation as a ggplot2 layer.
Source: R/simulation-utils.R
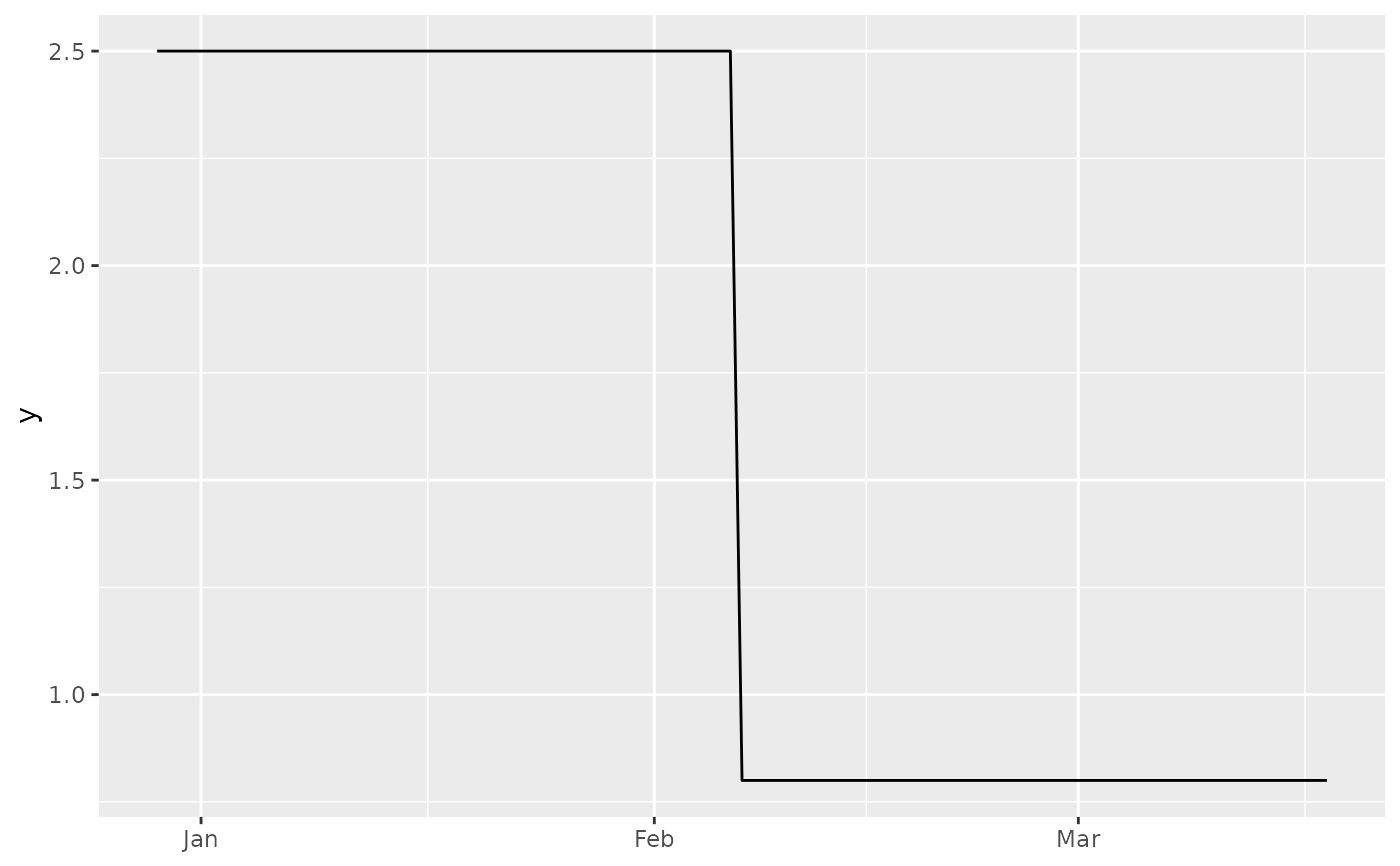
sim_geom_function.Rdsimulations are typically parameterised by time varying $R_t$ or by growth
rate, and this relationship is embedded in the simulation outputs. Plotting
the value of these on the default ggoutbreak plots requires extracting this
function and rescaling it to align with the dates, which is what this function
does.
Arguments
- df
the output of a
ggoutbreaksimulation, typically this is going to be the input of an estimator.- ...
Named arguments passed on to
ggplot2::geom_functionmappingSet of aesthetic mappings created by
aes(). If specified andinherit.aes = TRUE(the default), it is combined with the default mapping at the top level of the plot. You must supplymappingif there is no plot mapping.dataIgnored by
stat_function(), do not use.statThe statistical transformation to use on the data for this layer. When using a
geom_*()function to construct a layer, thestatargument can be used to override the default coupling between geoms and stats. Thestatargument accepts the following:A
Statggproto subclass, for exampleStatCount.A string naming the stat. To give the stat as a string, strip the function name of the
stat_prefix. For example, to usestat_count(), give the stat as"count".For more information and other ways to specify the stat, see the layer stat documentation.
positionA position adjustment to use on the data for this layer. This can be used in various ways, including to prevent overplotting and improving the display. The
positionargument accepts the following:The result of calling a position function, such as
position_jitter(). This method allows for passing extra arguments to the position.A string naming the position adjustment. To give the position as a string, strip the function name of the
position_prefix. For example, to useposition_jitter(), give the position as"jitter".For more information and other ways to specify the position, see the layer position documentation.
...Other arguments passed on to
layer()'sparamsargument. These arguments broadly fall into one of 4 categories below. Notably, further arguments to thepositionargument, or aesthetics that are required can not be passed through.... Unknown arguments that are not part of the 4 categories below are ignored.Static aesthetics that are not mapped to a scale, but are at a fixed value and apply to the layer as a whole. For example,
colour = "red"orlinewidth = 3. The geom's documentation has an Aesthetics section that lists the available options. The 'required' aesthetics cannot be passed on to theparams. Please note that while passing unmapped aesthetics as vectors is technically possible, the order and required length is not guaranteed to be parallel to the input data.When constructing a layer using a
stat_*()function, the...argument can be used to pass on parameters to thegeompart of the layer. An example of this isstat_density(geom = "area", outline.type = "both"). The geom's documentation lists which parameters it can accept.Inversely, when constructing a layer using a
geom_*()function, the...argument can be used to pass on parameters to thestatpart of the layer. An example of this isgeom_area(stat = "density", adjust = 0.5). The stat's documentation lists which parameters it can accept.The
key_glyphargument oflayer()may also be passed on through.... This can be one of the functions described as key glyphs, to change the display of the layer in the legend.
arrowArrow specification, as created by
grid::arrow().arrow.fillfill colour to use for the arrow head (if closed).
NULLmeans usecolouraesthetic.lineendLine end style (round, butt, square).
linejoinLine join style (round, mitre, bevel).
linemitreLine mitre limit (number greater than 1).
na.rmIf
FALSE, the default, missing values are removed with a warning. IfTRUE, missing values are silently removed.show.legendlogical. Should this layer be included in the legends?
NA, the default, includes if any aesthetics are mapped.FALSEnever includes, andTRUEalways includes. It can also be a named logical vector to finely select the aesthetics to display. To include legend keys for all levels, even when no data exists, useTRUE. IfNA, all levels are shown in legend, but unobserved levels are omitted.inherit.aesIf
FALSE, overrides the default aesthetics, rather than combining with them. This is most useful for helper functions that define both data and aesthetics and shouldn't inherit behaviour from the default plot specification, e.g.annotation_borders().geomThe geometric object to use to display the data for this layer. When using a
stat_*()function to construct a layer, thegeomargument can be used to override the default coupling between stats and geoms. Thegeomargument accepts the following:A
Geomggproto subclass, for exampleGeomPoint.A string naming the geom. To give the geom as a string, strip the function name of the
geom_prefix. For example, to usegeom_point(), give the geom as"point".For more information and other ways to specify the geom, see the layer geom documentation.
funFunction to use. Either 1) an anonymous function in the base or rlang formula syntax (see
rlang::as_function()) or 2) a quoted or character name referencing a function; see examples. Must be vectorised.xlimOptionally, specify the range of the function.
nNumber of points to interpolate along the x axis.
argsList of additional arguments passed on to the function defined by
fun.
Examples
ggplot2::ggplot()+
  sim_geom_function(example_poisson_rt(), xlim=as.Date("2019-12-29")+c(0,80))+
  ggplot2::scale_x_date()