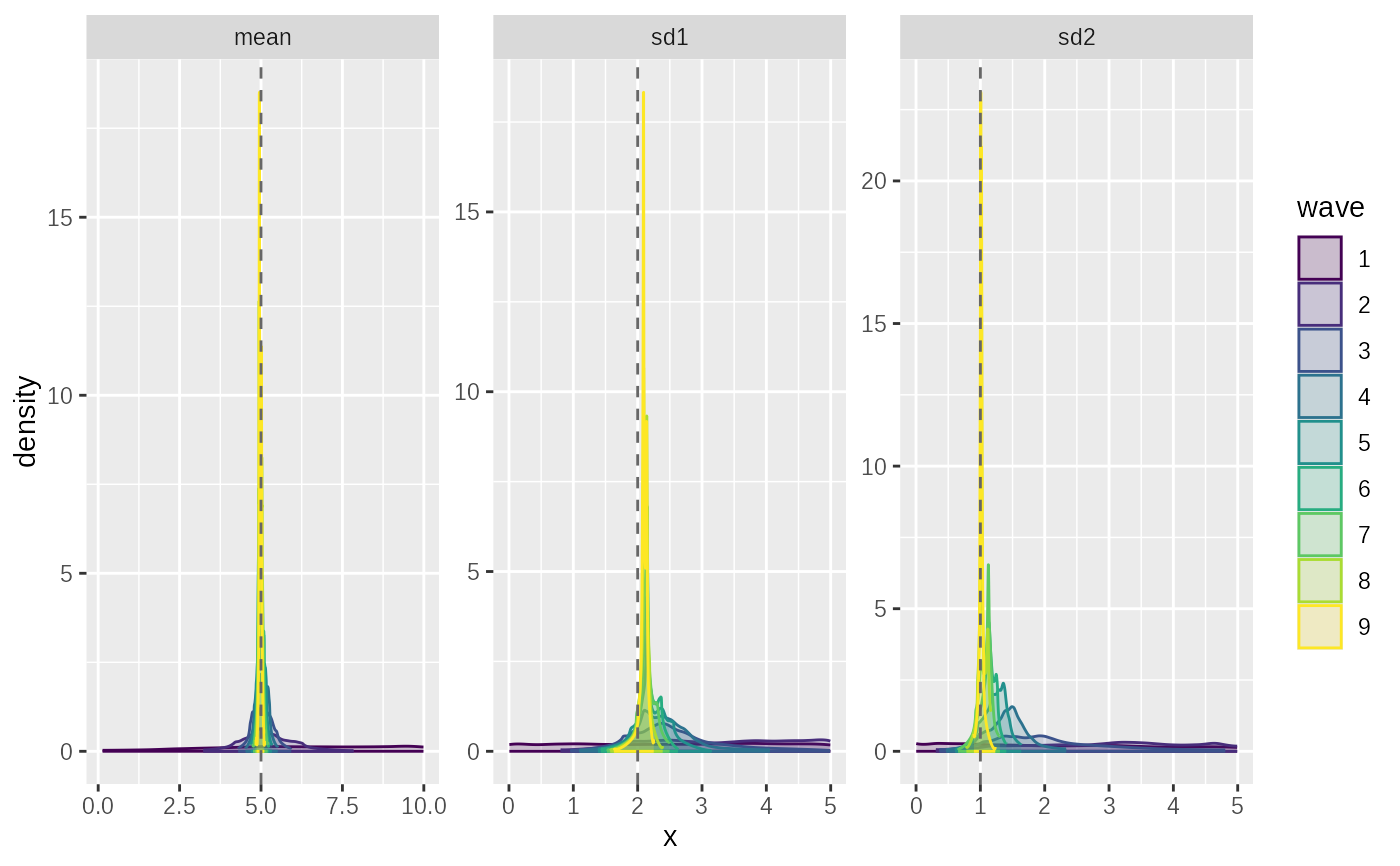
Plot the evolution of the density function by wave for SMC and adaptive ABC
Source:R/plot-convergence.R
plot_evolution.RdPlot the evolution of the density function by wave for SMC and adaptive ABC
Usage
plot_evolution(fit, truth = NULL, ..., what = c("posteriors", "proposals"))Arguments
- fit
A S3
abc_fitobject as output by theabc_XXXfunctions- truth
a named numeric vector of known parameter values
- ...
passed on to methods Named arguments passed on to
plot.dist_fns_listmappingoverride default aesthetics with
name,idorgroupstepsresolution of the plot
tailthe minimum tail probability to plot
plot_quantilesby default the quantiles of the distribution are plotted over the density sometimes this makes it hard to read
smoothby default some additional smoothing is used to cover up small discontinuities in the PDF.
- what
plot posterior densities or proposal distributions?
Examples
plot_evolution(
  example_adaptive_fit(),
  example_truth()
)