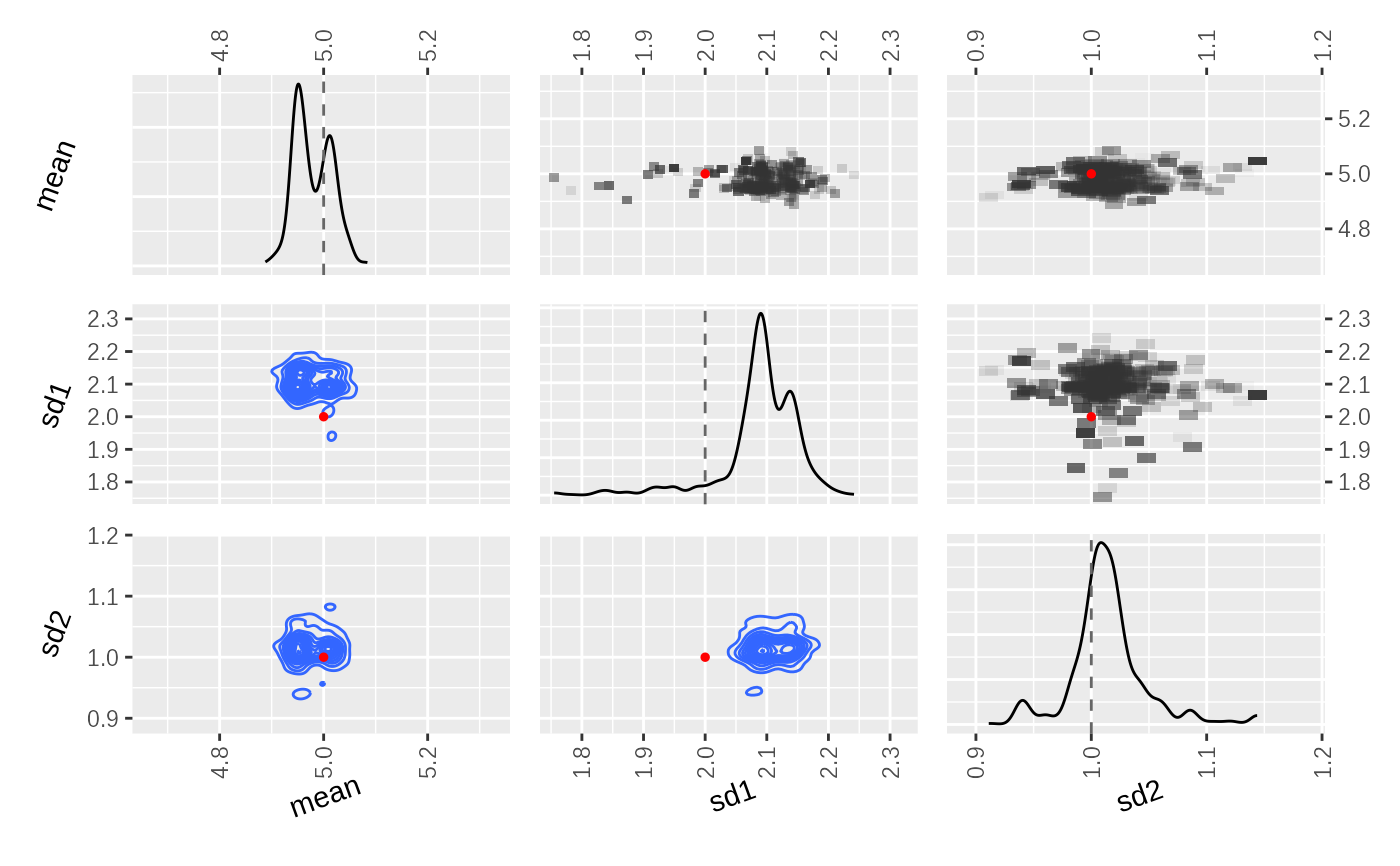
A parameter posterior correlation plot
Arguments
- posteriors_df
a dataframe of posteriors that have been selected by ABC this may include columns for scores, weight and/or simulation outputs (
abc_component_score,abc_summary_distance,abc_weight,abc_simulation) as well as columns matching thepriorsinput specification.- truth
a named numeric vector of known parameter values
Examples
p = plot_correlations(
  example_adaptive_fit(),
  example_truth()
)

p & ggplot2::theme(
  axis.title.y = ggplot2::element_text(angle=70,vjust=0.5),
  axis.title.x = ggplot2::element_text(angle=20,hjust=0.5)
)